
How to Look Up St. Louis City Jail Population Data
The city runs a public dashboard for jail numbers. It is the main source for St. Louis City inmate population data. The dashboard offers a Data by Year view and a Data by Day view. You pick a Start Year, an End Year, a Measure, and an Attribute, then the chart redraws. Start and end years run from 1995 through 2026, so the tool reaches back three decades.
The Measure choices include Average Daily Population and Average Length of Stay. The Attribute choices include Total Population, Race, Sex, Facility, Marital Status, Employment Status, Top Offense Class, and Age Group. That mix lets you build a yearly trend or a single-day snapshot for almost any slice of the jail count. The data refreshes on the city's schedule, so it carries live figures rather than a fixed report.
Open the official inmate population dashboard to set the year range and attribute.
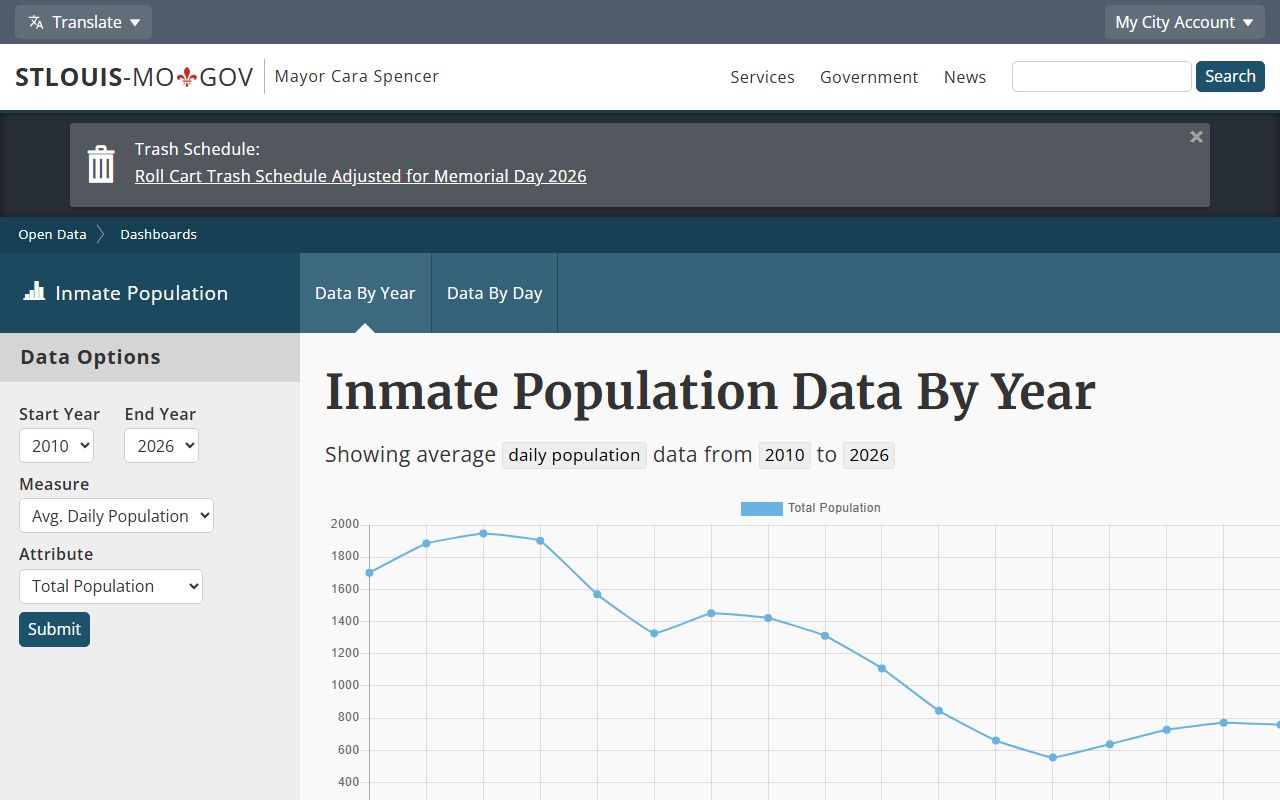
The dashboard's year and day filters drive the charts that supply every figure on this page.
St. Louis City Jail Capacity Overview
The city now runs one detention site. The City Justice Center is the official primary jail, and it can hold 860 people. It is a six-story building that opened in 2002. The old Medium Security Institution, the Workhouse, closed in 2021, and its inmates moved to the City Justice Center. The capacity table below marks which facility is open and which is history.
| Facility | Capacity | Status | Notes |
|---|---|---|---|
| City Justice Center | 860 | Open | Six-story facility opened in 2002; primary city detention site. |
| Medium Security Institution (Workhouse) | Closed | Closed 2021 | Historical facility; inmates moved to the City Justice Center. |
Capacity is a city-specific figure. With one open facility rated for 860 beds, the city's recent daily counts sit close to that ceiling, which matters for how the jail manages housing and classification.
St. Louis City Average Daily Population
The headline number is average daily population. It is the mean count of people held across the day, averaged over the period you pick. The corrections landing page also posts a "Today's Population" figure for a single date. On May 11, 2026, the displayed total confined across all facilities was 771. That date-specific number should not be treated as the count for any later day; the dashboard carries the live figure.
A daily figure near 771 sits close to the 860-bed capacity. That single day would equal roughly 90% of the rated capacity before you account for classification, beds reserved for inmates listed as "Out," maintenance beds, or housing separation needs. So even a count below capacity can leave the jail with little open space in practice.
Average length of stay is the other measure on the dashboard. It tracks how long, on average, a person is held before release or transfer. Read together, daily population and length of stay explain the count: a jail can hold the same number of people through many short stays or fewer long ones. Both measures pull from the same City Justice Center data and can be filtered by year or by day.
St. Louis City Inmate Population Trends
The yearly trend tells a clear story. The city jail held far more people in the early 2010s than it does now. The average daily total population topped 1,700 from 2010 through 2013 and peaked at 1,947 in 2012. It then fell sharply, hit a low of 554 in 2022, and has rebounded since. The table below lists the average daily total population by year, drawn from the city dashboard chart.
| Year | Average Daily Total Population |
|---|---|
| 2010 | 1,704 |
| 2011 | 1,885 |
| 2012 | 1,947 |
| 2013 | 1,902 |
| 2014 | 1,569 |
| 2015 | 1,328 |
| 2016 | 1,451 |
| 2017 | 1,422 |
| 2018 | 1,312 |
| 2019 | 1,109 |
| 2020 | 845 |
| 2021 | 661 |
| 2022 | 554 |
| 2023 | 637 |
| 2024 | 726 |
| 2025 | 767 |
| 2026 | 751 |
The recent climb is steady. The count rose from 554 in 2022 to 637 in 2023, 726 in 2024, and 767 in 2025, with 2026 shown at 751 in the inspected chart. Against the 2012 peak of 1,947, the jail population remains far lower, but it has bounced back well off the pandemic-era floor and now sits near the 860-bed capacity.
St. Louis City Inmate Demographics
The dashboard does more than count heads. Its Attribute menu can split the population by Race, Sex, Age Group, Marital Status, and Employment Status. You change the attribute, and the chart redraws for that slice over the year range you set. This lets a user see how the jail population breaks down rather than just the total.
A full extracted demographic table was not captured during research, so the live dashboard is the source for current race, sex, and age figures. The attribute filters are city-specific and reflect the City Justice Center population. To pull a current breakdown, set the Data by Year or Data by Day view and pick the attribute you want.
Note: Demographic shares shift over time, so use the live dashboard attribute filters for current race, sex, and age figures rather than a fixed snapshot.
St. Louis City Pretrial Versus Sentenced
A jail is not a prison. Most people in a city jail are awaiting court action, not serving a long sentence. The City Justice Center holds people arrested by police, those held pretrial on bond they have not posted, and people on shorter local matters. State sentences are served in the Missouri Department of Corrections, not the city jail, which keeps the city count weighted toward pretrial and local cases.
The dashboard's offense and classification data help show the mix. One disclaimer notes that a person may be charged with multiple classifications, and the displayed value uses the highest classification. So the offense breakdown reflects the most serious charge per person, which is worth keeping in mind when reading a pretrial picture from the jail count.
The pretrial weight also shapes the population swings seen in the yearly trend. When bond practice, charging, or court scheduling changes, the pretrial count moves first, since those people make up so much of the jail. The sharp drop from the 2012 peak to the 2022 low, and the steady climb since, both reflect shifts in who is held before trial rather than a change in the city's sentenced population.
Misdemeanor Versus Felony Population
The dashboard tracks offense class through its Top Offense Class attribute. That field sorts the population by the level of the most serious charge tied to each person. It lets a user see the split between lower-level and serious charges in the jail count over a chosen year range.
The classification rule matters here. Because the dashboard uses the highest classification when a person faces multiple charges, the felony side can look heavier than a simple charge count would suggest. State felony cases in the city are prosecuted by the Circuit Attorney and heard in the 22nd Judicial Circuit, while municipal and minor matters route through the Municipal Division. The underlying cases behind these counts are searchable through the St. Louis City court records page.
Mental Health and Medical Population
Some of the jail population needs care, not just custody. The City Justice Center runs programs that touch behavioral health and medical needs, including Dual Diagnosis and W.E.N. substance-abuse programming. SLU Occupational Therapy Training to Employment and related offerings also reach people with treatment and reentry needs.
These programs reflect a population with real health needs, and the treatment courts of the 22nd Circuit work to divert some of these people from custody. A dashboard disclaimer also notes that population data includes inmates listed as "Out," meaning a person temporarily out of the facility but expected to return, so a bed stays reserved. Another disclaimer notes the count may run as much as 5% higher because the system counts everyone in the City Justice Center, including inmates and detainees.
National and State Context
City numbers read best against the larger picture. National jail and prison statistics come from the Bureau of Justice Statistics, while state-level incarceration profiles come from groups like the Prison Policy Initiative and the Vera Institute. These sources report rates per 100,000 residents, which lets you compare places of different sizes. The comparison block below frames where the city figures sit.
| Level | Source | What It Measures |
|---|---|---|
| City of St. Louis (county-specific) | City inmate population dashboard | Average daily jail population at the City Justice Center, by year and day. |
| Missouri (state) | Prison Policy Initiative Missouri profile | Statewide incarceration rate per 100,000 across jails and prisons. |
| United States (national) | Bureau of Justice Statistics | National jail and prison counts and rates per 100,000. |
For national figures, the Bureau of Justice Statistics publishes jail and corrections data each year.

That national data sets the baseline rate that a city or state figure can be measured against.
For the state picture, the Prison Policy Initiative Missouri profile reports the statewide rate per 100,000.
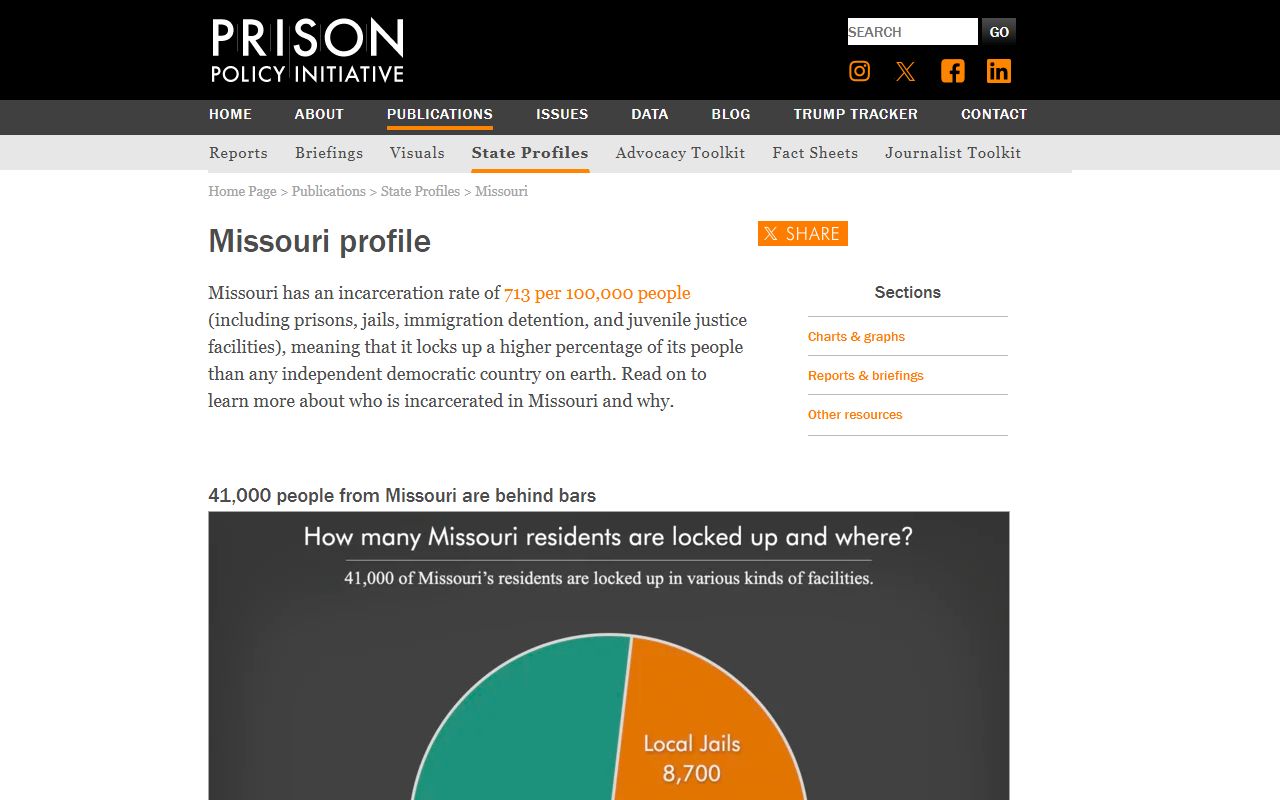
The Missouri profile is a state figure, not a city one, so it provides context rather than a direct City Justice Center count.
Searching for St. Louis City Inmates by Name
This page is population data, not a person lookup. To find a specific person rather than a count, use the jail roster on the St. Louis City inmate records page, which covers the locator and the profile fields. To check a recent release, use the released inmates page. The dashboard answers how many, while the locator answers who.
Where the Data Comes From
The figures on this page trace to official sources. The yearly trend, the average daily population, and the demographic attributes all come from the City of St. Louis inmate population dashboard. The 860 capacity figure comes from the official City Justice Center page. The single-day total of 771 confined comes from the corrections landing page for May 11, 2026.
National and state comparisons come from the Bureau of Justice Statistics and the Prison Policy Initiative. The Vera Institute also publishes county-level incarceration trends that include jurisdictions like the City of St. Louis. Because the city dashboard updates on its own schedule, the live tool is always the best source for a current count. For the cases behind the numbers, see the St. Louis City arrest records page.
It helps to keep the levels straight. The city dashboard counts only people in the City Justice Center, a single jail. State and federal figures count prisons and many jails across a much wider area. So a city jail count and a statewide rate are not the same kind of number, and they should not be added together or compared head to head. Use the city dashboard for the local jail, the state profile for Missouri as a whole, and the national data for the country.
One more note on accuracy. The dashboard's own disclaimers warn that the count can run as much as 5% higher because it includes everyone in the building, and that beds reserved for "Out" inmates still count. Reading the figures with those rules in mind keeps a St. Louis City inmate population search honest.